
A website redesign ROI calculator is only as useful as the numbers behind it. Use one to estimate whether a redesign could earn back its investment by comparing current and projected revenue, lead value, close rates, and ongoing costs such as hosting. The result is a practical forecast, not a promise.
It’s easy to focus on the visible transformation: a clearer layout, a more polished brand, and a smoother path to action. But the business case depends on what those changes may do for conversions and revenue, measured against the full cost of the work.
This guide shows you how to build that estimate step by step. You’ll learn how to set a baseline, project leads and sales using conversion and close rates, calculate ROI and payback, and include hosting and maintenance in the total. With a sound formula and realistic assumptions, you can turn a redesign from a hopeful idea into a decision grounded in business outcomes.
Key Takeaways
- Set a reliable baseline with recent traffic, conversion, lead, and revenue data before projecting what a redesign could change.
- Translate conversion improvements into business outcomes by factoring in lead quality, close rates, and the value of each sale.
- Use a clear ROI formula and payback period to compare projected gains with the full redesign investment.
- Include recurring hosting and maintenance expenses so the calculation reflects the ongoing cost of running the site.
- Track qualitative benefits such as stronger brand trust and improved sales enablement alongside revenue measures.
What is a website redesign ROI calculator?
A website redesign ROI calculator estimates whether a new site could generate enough financial value to justify its investment. It connects traffic, conversion rate, lead value, and projected revenue, rather than treating visual change as success on its own.
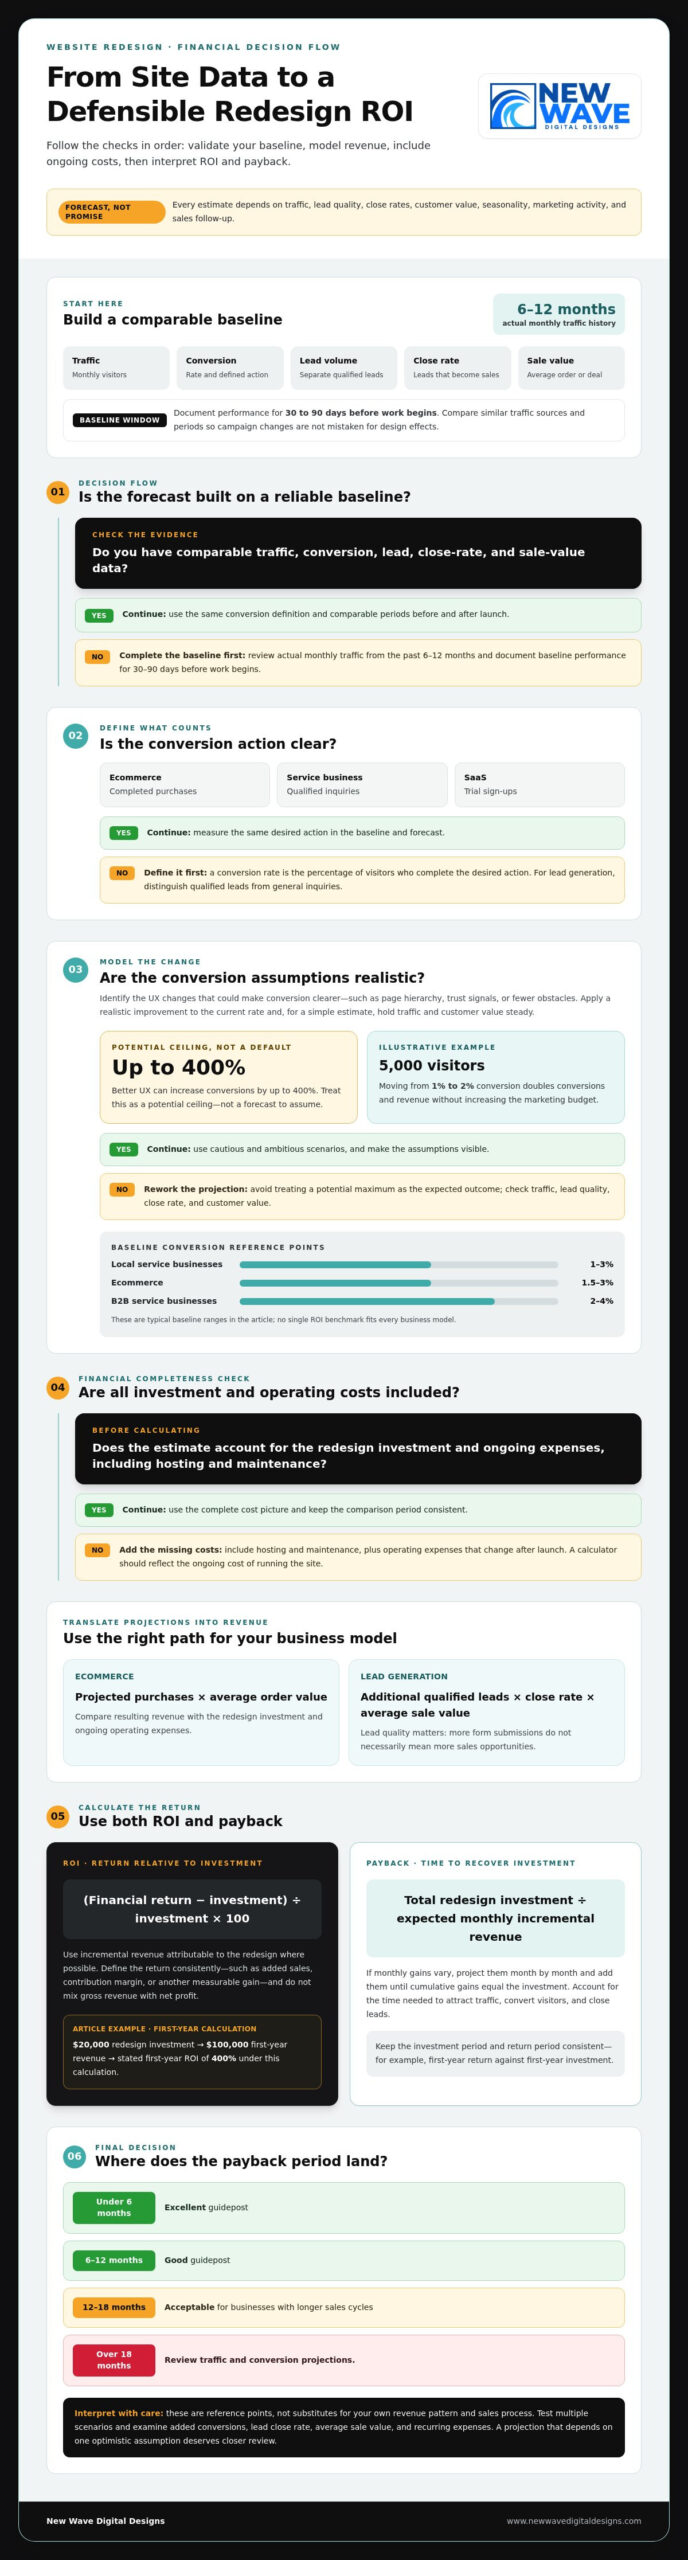
For small businesses, ecommerce, and B2B sites, there is no single ROI benchmark that fits every model. Typical baseline conversion rates are 1 to 3% for local service businesses, 1.5 to 3% for ecommerce, and 2 to 4% for B2B service businesses.
Measure benefits by comparing conversions before the redesign with projected conversions, then translating the difference into sales or lead revenue. For a service business, multiply additional qualified leads by the proportion that close and the average value of each sale.
Compare traffic, conversion rate, qualified leads, close rate, average order or deal value, and resulting revenue before and after launch. Use actual monthly traffic from the past 6-12 months and document baseline performance for 30 to 90 days before work begins.
Estimate conversion improvements by applying a realistic increase to your current rate, then holding traffic and customer value steady. For example, at 5,000 visitors, moving from a 1% conversion rate to 2% doubles conversions and revenue without increasing the marketing budget.
Every estimate depends on assumptions about traffic, lead quality, close rates, and customer value. Seasonality, marketing activity, and sales follow-up can also affect results, so treat the projection as a model, not proof of future performance.
- Choose the conversion that matters. Count completed purchases for ecommerce, qualified inquiries for a service business, or trial sign-ups for a SaaS site. The conversion rate is the percentage of website visitors who complete the desired action. Define that action clearly so your baseline and forecast measure the same outcome.
- Set a credible baseline. Record monthly traffic, conversion rate, lead volume, close rate, and average sale value. Separate qualified leads from general inquiries, since a redesigned form might attract more submissions without increasing sales opportunities. Compare similar traffic sources and periods to avoid mistaking campaign changes for design effects.
- Model design and user-experience changes. Identify what will make the path to conversion clearer, such as stronger page hierarchy, useful trust signals, or fewer obstacles in a purchase or inquiry flow. Better UX can increase conversions by up to 400%; use that as a potential ceiling, not a default forecast. Build conservative and ambitious scenarios instead.
- Translate projections into revenue. Multiply projected ecommerce conversions by average order value, or multiply lead-generation conversions by close rate and average deal value. Compare the resulting revenue with the redesign investment and ongoing operating expenses. A calculator makes assumptions visible, helping you judge whether improved conversion, traffic, or both could support financial success.
Website redesign ROI and payback formulas
Use two complementary measures: ROI shows the return relative to investment, while payback shows how long recovery takes. Calculate both using consistent revenue assumptions and a clearly defined investment period.
-
Calculate Website Redesign ROI
Calculate ROI by subtracting the redesign investment from its financial return, dividing the result by the investment, then multiplying by 100. For example, a $20,000 redesign generating $100,000 in first-year revenue produces a stated first-year ROI of 400% under this calculation. Use incremental revenue attributable to the redesign where possible, rather than crediting the new site with revenue it would have generated anyway.
Before comparing results, define which return counts: added sales, contribution margin, or another measurable financial gain. Keep the period consistent, such as first-year return against first-year investment, and avoid mixing gross revenue with net profit. If operating expenses change after launch, include them in the investment or ongoing costs. This makes the calculation more useful when deciding whether the project supports your business goals.
-
Estimate the Payback Period
Estimate payback by dividing the total redesign investment by the expected monthly incremental revenue from the new site. If monthly gains vary, project them month by month and add them until cumulative gains equal the investment. Account for the time it takes to attract traffic, convert visitors, and close leads, especially when sales take longer.
Use these calculator guideposts to interpret the result: a payback period under 6 months is excellent, 6-12 months is good, and 12-18 months is acceptable for businesses with longer sales cycles. A period over 18 months is a reason to review traffic and conversion projections. These ranges are reference points, not substitutes for examining your own revenue pattern and sales process.
Test the estimate with multiple scenarios. Compare cautious assumptions with a stronger improvement goal, then identify which factors have the greatest effect on the payback date: added conversions, lead close rate, average sale value, or recurring expenses. A result that depends on one optimistic assumption deserves closer examination before you act.
Once the projected return and investment period are clear, align the rebuild with the platform and experience your business needs. A Shopify project may pair the financial plan with Shopify website design focused on the customer journey.
Lead value, close rates, and revenue projections
Turn lead performance into revenue by connecting qualified inquiries, close rates, and deal value. Then project the change across monthly and annual periods, accounting for ongoing costs and revenue attribution.
-
Estimate Lead Value and Close Rates
Start with monthly sales-qualified leads, your close rate, and average deal size. For example, 10 qualified leads closing at 20% produce two sales; at $50,000 per deal, that represents $100,000 in monthly revenue. Use qualified leads, not all form submissions, and apply the close rate to the same lead group.
Next, estimate how improved engagement or conversion rates could affect qualified lead volume. If performance rises by 10%, the example projects $10,000 in incremental monthly revenue. Treat that lift as a scenario, then test a lower or higher projection against your sales history.
-
Project Revenue Increases
Calculate projected monthly revenue first, then extend it across a year using the same assumptions. Separate current revenue from incremental revenue so existing sales aren’t counted as redesign gains. Subtract recurring operating expenses from the projected uplift to see how much remains to offset the initial investment.
For a longer view, compare outcomes over 12-24 months rather than judging performance after 90 days. A website redesign example may use an anticipated project lifetime of 5 years, but extend projections only while the underlying traffic, conversion, and sales assumptions remain relevant.
- Attribute revenue carefully. Record the source of each lead and connect it to the resulting sale. Compare post-launch results with the pre-redesign baseline while tracking changes in advertising, seasonality, or sales follow-up. This helps distinguish revenue associated with the redesigned experience from growth driven by other factors.
For sales with a long decision process, track qualified leads and pipeline movement alongside closed revenue. A lead generated through the site may close later, so assign revenue to a consistent period and avoid counting the same opportunity twice.
- Build a transparent estimate. Keep a simple forecast with monthly visitors, conversion rates, qualified leads, close rate, average deal value, projected revenue, and ongoing expenses. Calculate monthly uplift before annualizing it; multiplying one unusually strong month by 12 can distort the estimate.
Finally, compare conservative and stronger growth scenarios. If the forecast relies on a large conversion increase but assumes lead quality stays the same, test whether the sales team can handle the added pipeline. This makes the revenue projection more useful for planning than a single optimistic total.
Do I need to include my hosting costs in the ROI calculation?
Yes. Include hosting, maintenance, and security expenses alongside the redesign investment to calculate a more complete return. Website operating costs are recurring expenses that 41 percent of enterprise CFOs scrutinize during procurement reviews.
- Build a complete cost baseline. Add development fees, internal labor, technology and licensing, and any temporary traffic dip to the project investment. Then list recurring hosting and maintenance expenses separately, using the billing period shown in your records. This distinction keeps a one-time redesign investment separate from the annual cost of running the site.
- Calculate direct, measurable returns. Compare incremental revenue with the full costs tied to the redesigned site. Subtract expenses from revenue to find net return, then divide net return by investment and multiply by 100 for ROI. Keep the time period consistent: compare annual returns with annual operating expenses, not a single month’s revenue against a year of costs.
- Track qualitative returns beside revenue. Brand recognition, buyer confidence, and sales enablement can influence decisions before a customer converts. Record practical indicators such as repeat visits, engagement with key product pages, and sales-team use of website content. Poor website experiences leave 88 percent of online shoppers less likely to return, making retention and user experience relevant signals alongside direct sales.
- Separate short-term results from long-term value. A digital strategy may create immediate gains through clearer calls to action, while stronger brand trust develops through repeated customer interactions. Review measurable conversion and revenue results separately from qualitative indicators. For example, track completed purchases in one group and sales-team feedback about content usefulness in another.
- Review costs and returns over matching periods. Include ongoing hosting and maintenance in each annual projection, then compare the remaining revenue uplift with the original investment. If hosting or support needs change as traffic grows, update the operating-cost forecast. This shows whether the site’s long-term value continues to outweigh the expenses needed to keep it secure, available, and effective.
Website redesign ROI formula
Use actual performance metrics to build a forecast you can revisit after launch. The key is to separate profit created by the redesign from revenue the existing site would have earned.
- Set the measurement period. Record baseline results before work begins, then compare them with post-launch performance over matching periods. Document metrics for 30 to 90 days before the project begins, and use average monthly traffic from the past 6-12 months to ground projections. Note changes in campaigns or seasonality that could affect the comparison.
- Calculate the full investment. Include agency or build-team fees, internal labor, technology and licensing, and the cost of a temporary traffic dip. Add recurring operating expenses for the period being assessed. Leaving out internal work or ongoing costs can make projected profit appear stronger than the actual return.
- Estimate incremental profit. Project the added conversions attributable to the redesigned site, then multiply them by revenue per conversion. Subtract the costs required to deliver those sales, such as product or service fulfillment. For lead-generation sites, use the close rate to translate added qualified leads into revenue.
- Apply the ROI equation. Use this formula: ROI = ((incremental profit − total investment) ÷ total investment) × 100. Keep the period and cost definitions consistent, and avoid treating total website revenue as incremental profit.
- Check the forecast against actual results. For example, 10,000 monthly visitors at a 1% conversion rate generate 100 conversions. A 0.5% conversion-rate increase adds 50 monthly sales in the provided example. Multiply those additional conversions by actual revenue per sale, then compare the result with analytics and sales records.
- Use payback to guide decisions. Divide total investment by average monthly incremental profit to estimate the payback period. If monthly gains vary, add each month’s incremental profit until cumulative gains recover the investment. Review ROI during months 6 to 12 after launch, then consider performance across 12-24 months.
Turn the formula into a working project plan by connecting measurable goals with the site’s structure and design. Plan a website redesign around the metrics that matter to your business.
New Wave Digital Designs: Shopify Website Design
New Wave Digital Designs shapes Shopify, WordPress, and SquareSpace websites around business goals, customer journeys, and brand identity. If your ROI estimate points to friction in the shopping experience, Shopify Website Design can create a clearer path from product discovery to purchase. Website Maintenance supports your site after launch as your content and business needs evolve.
Bring your goals, current site metrics, and projected outcomes into the redesign conversation. This gives the project a practical foundation: the experience you want to create, the platform that fits, and the results you plan to measure. To discuss your website needs, contact New Wave Digital Designs or visit www.newwavedigitaldesigns.com.
Turn your forecast into a thoughtful next step
A website redesign ROI calculator can inform a stronger brief, but its real value lies in the decisions it helps you make. Identify the customer action your site should support, the impression your brand should leave, and the signals you’ll use to assess progress. This gives your redesign a clear direction before creative and technical choices begin.
New Wave Digital Designs can translate that direction into a considered website experience. Its Shopify Website Design, WordPress Website Design, and SquareSpace Website Design offerings give businesses platform options for shaping their online presence. Bring your priorities and the assumptions behind your estimate into the conversation so the project can start with shared goals and a clear sense of purpose.
Contact New Wave Digital Designs to discuss your website plans. With a thoughtful brief and a defined direction, you can move from projection to purposeful progress.
Frequently Asked Questions
How Fast Does a Website Design Pay for Itself?
Payback time is when cumulative incremental profit covers the redesign investment, and it varies by business model. Typical estimates range from 2 to 6 months for local service businesses, 3 to 9 months for B2B services, 1 to 6 months for ecommerce, and 6 to 18 months for SaaS. Compare these benchmarks with your own sales cycle and contribution margin; revenue alone can overstate how quickly cash is recovered.
How do I choose the right numbers to enter into the calculator?
Enter actual inputs from comparable periods, not aspirational targets: monthly visitors, conversion rate, qualified leads, close rate, average order or deal value, and ongoing expenses. Use the same conversion event and traffic sources for your baseline and forecast. Then create a conservative case and a stretch case, changing one assumption at a time. This reveals whether projected gains depend mainly on more traffic, stronger conversion, or sales follow-up.
How long does it usually take to see a positive ROI after a redesign?
Many businesses begin seeing positive redesign ROI within 6 to 18 months, but the timeline depends on sales cycles and how quickly added leads become revenue. Positive ROI means cumulative financial gains have exceeded the investment over the period measured. A site can show stronger engagement earlier, while sales attributed to longer B2B buying journeys may take more time to close and appear in revenue reports.
Is a New Website Worth the Investment?
A new website can be worth investing in when it addresses a specific business constraint, such as a confusing purchase journey or pages that fail to explain your offer. Set a measurable objective first, such as improving qualified inquiries or completed purchases, then compare the expected benefit with project and operating costs. If the existing site already supports those outcomes, targeted improvements may be more appropriate than a full rebuild.
Is it possible for a redesign to have a negative ROI?
Yes. ROI is negative when attributable incremental profit falls short of the total investment during the measured period. This can happen if the redesign reduces conversions, attracts less qualified traffic, or adds operating expenses without improving results. For a fair assessment, compare equivalent periods and include relevant costs. Also account for changes in advertising or sales activity, which could otherwise make the redesigned site appear responsible for unrelated gains or losses.
What factors have the biggest impact on website ROI?
The strongest drivers are often traffic quality, conversion rate, average order or deal value, lead close rate, and ongoing costs. Their importance depends on your business model: an ecommerce forecast depends heavily on order value, while a B2B projection relies on lead qualification and sales conversion. Test each assumption separately. If changing one input sharply shifts projected profit or payback, prioritize validating that input.
How do you calculate website redesign ROI?
Calculate ROI by subtracting the total investment from incremental profit, dividing that result by the investment, then multiplying by 100. The key is defining incremental profit: count gains linked to the redesigned experience, not all revenue flowing through the site. For example, compare sales from similar traffic sources before and after launch, while accounting for changes in campaigns, pricing, and sales processes.
What costs should a website redesign ROI calculator include?
Include build-team or agency fees, internal labor, technology and licensing, temporary traffic losses, and recurring hosting and maintenance expenses. Separate one-time project costs from ongoing operating costs, then assign each to the period used in your forecast. Avoid double counting: if maintenance is included in annual operating costs, don’t add it again as part of the initial redesign investment.