
A high bounce rate isn’t automatically a sign that your website is failing. If you’re wondering why your website bounce rate is so high, start by looking at what visitors came to do, where they came from, and whether the page fulfilled that purpose. Bounce rate counts sessions that begin and end without further interaction, so someone who finds the information they need on one page can still contribute to a high rate.
A high bounce rate can look like proof that visitors are leaving because something is wrong, but the number alone cannot explain why your website bounce rate is so high. The right interpretation depends on the page, its audience, and its purpose. Learn how bounce rate works, compare like-for-like pages, and trace a concerning result through visitor intent, traffic sources, and site goals. The aim is to distinguish a genuine experience problem from a page that successfully answers a visitor’s question in one visit.
Key Takeaways
- Interpret bounce rate in context: a single-page visit can still be successful if it meets the visitor’s goal.
- Compare performance by page type, traffic source, and audience rather than relying on one sitewide benchmark.
- Match each landing page’s message and next step to the intent that brought visitors there.
- Prioritize high-traffic landing pages when investigating where exits may be affecting the overall picture.
- Judge page performance against its purpose, using relevant engagement and conversion signals alongside bounce rate.
What is bounce rate?
- Identify what the metric counts. Bounce rate describes the share of sessions in which visitors view one page and take no further action. It measures sessions, not the total number of individual visitors, so one person’s separate visits can contribute more than once. A bounce can happen when someone closes a tab, uses the back button, enters another URL, or leaves through an external link. The specific interaction that counts as engagement depends on how the analytics tool defines it. Read the metric alongside the page and session details, rather than treating it as a direct measure of visitor satisfaction.
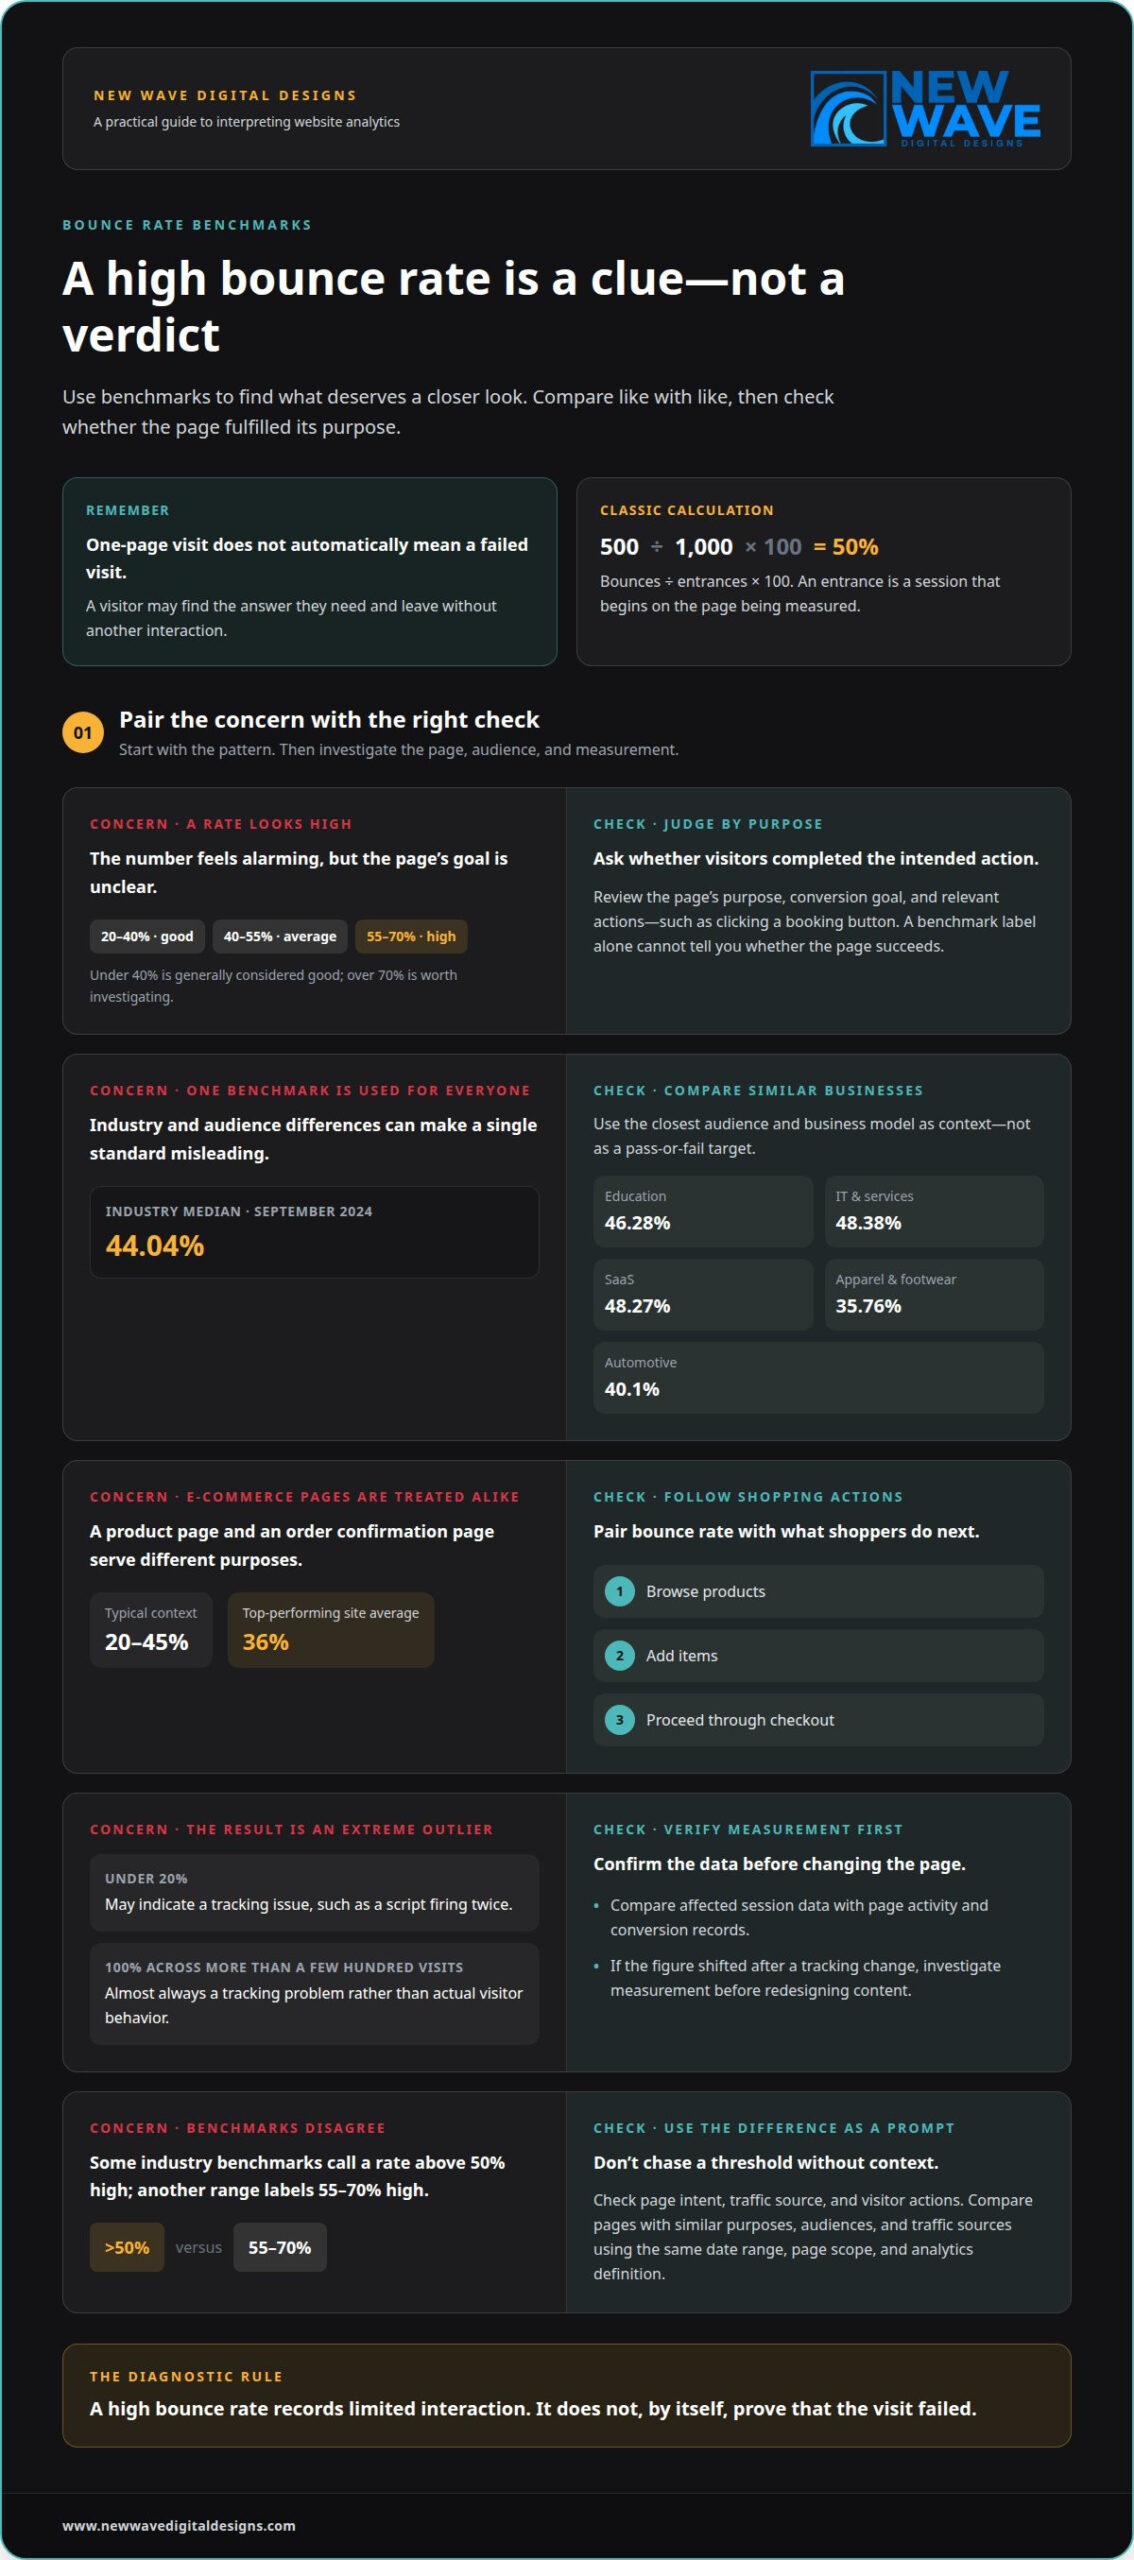
- Apply the classic calculation. Divide the total number of bounces by the total number of entrances, then multiply by 100 to get a percentage. For example, 500 bounces from 1,000 entrances produce a 50% bounce rate: 500 ÷ 1,000 × 100. An entrance is a session that begins on the page being measured. This makes bounce rate especially relevant to landing pages, where the entry experience is the focus. Use the same date range, page scope, and analytics definition when comparing results; otherwise, the calculation may describe different groups of sessions.
- Compare bounce rate with engagement rate. In a session-based example, 1,000 sessions with 320 unengaged sessions produce a 32% bounce rate. The remaining sessions can be treated as engaged when they meet the analytics tool’s criteria. In this framing, engagement rate and bounce rate complement each other: together, they show how sessions divide between engaged and unengaged visits. A 30% bounce rate corresponds to a 70% engagement rate. Confirm that both percentages use the same sessions and definitions before interpreting the relationship. A high bounce rate signals limited recorded interaction, not automatically a failed visit.
- Separate a bounce from an exit. Bounce rate describes sessions in which a visitor lands on a page and leaves without further interaction. Exit rate measures how often visitors leave from a particular page, even if they viewed other pages first. For example, someone who reads two pages and then leaves contributes to an exit from the second page, but not a bounce. Keep the difference in mind when diagnosing a high rate: it helps show whether visitors leave immediately after landing or later in their journey.
How to interpret bounce rate benchmarks
Treat benchmarks as a starting point for diagnosis, not as a universal target. Compare pages with similar purposes, audiences, and traffic sources before deciding whether a result needs attention.
-
Interpret Good and High Benchmarks
Start by placing the result in a range: 20% to 40% is categorized as good, 40% to 55% as average, and 55% to 70% as high. A rate under 40% is generally considered good, while a rate over 70% is worth investigating. These labels don’t establish whether a page succeeds. Check its purpose, conversion goal, and whether visitors complete the intended action, such as clicking a booking button.
-
Compare Benchmarks by Industry
Compare your result with businesses serving similar audiences. The median bounce rate across industries was 44.04% in September 2024. In the same benchmark set, education was 46.28%, information technology and services was 48.38%, and SaaS was 48.27%. Apparel and footwear was 35.76%, while automotive was 40.1%. These differences show why a single industry-wide standard can mislead. Match the comparison to your business model and page purpose.
-
Assess E-commerce Performance
For e-commerce, use the typical range of 20% to 45% as context, not a pass-or-fail rule. The average bounce rate for top-performing e-commerce websites was 36%. A product page and an order confirmation page serve different purposes, so their results shouldn’t be judged as though visitors arrive with identical intentions. Pair the rate with conversion activity: check whether visitors browse products, add items, or proceed through checkout.
- Investigate outliers before changing a page. A bounce rate under 20% may point to an analytics tracking issue, such as a script firing twice. A 100% rate across more than a few hundred visits is almost always a tracking problem rather than actual visitor behavior. In Google Analytics, compare the affected session data with page activity and conversion records. If a figure shifts sharply after a tracking change, investigate measurement before redesigning content.
- Use benchmarks to choose a next step. A rate above 50% is described as high in some industry benchmarks, while another range labels 55% to 70% high. That difference is a reason to examine context, not to chase a threshold. Check page intent, traffic source, and visitor actions, including whether a button leads to the expected next step. A focused website performance review can help turn those signals into a clearer diagnosis.
Matching landing-page content to search intent
Make sure each landing page delivers on the promise that brought visitors there. Review the page’s message, traffic source, and intended next action as parts of the same experience.
-
Assess Content Quality and Self-Sufficiency
Check whether the landing page gives visitors relevant, useful information that answers their likely question. Common causes of a high bounce rate include a mismatch between an ad and its destination, thin or unclear content, slow loading, and a frustrating mobile experience. If you’re asking why your website’s bounce rate is so high, first check whether visitors find what they expected. A page can do its job in one visit, such as a contact page that clearly displays a phone number.
Check that the page explains its offer clearly and gives visitors enough information to decide what to do next. Don’t make essential details depend on another page or an unclear menu. For example, a service page should connect its target keyword to the service, explain its relevance, and offer a suitable next step.
-
Check Traffic Sources for Audience Mismatch
Compare landing-page performance by traffic source in Google Analytics 4. Review the source and campaign alongside the page visitors enter, then examine engagement and conversions for each group. If an advertisement promises a specific offer but its destination presents something different, visitors may leave without exploring further. That gap can help explain why your website’s bounce rate is so high for one campaign, without indicating a sitewide content problem.
Compare the wording of each ad, search result, or email with the page headline and visible offer. For example, an ad for a specific product should lead to a page featuring that product, not a general homepage. Segmenting results by source can reveal whether a particular audience or campaign is driving the unusually high rate.
- Inspect high-bounce landing pages in GA4. Compare individual landing pages rather than relying only on the sitewide metric. Review bounce rate alongside engagement, traffic source, and conversions, then identify pages that stand apart from similar pages. A high-traffic page with weak engagement deserves closer attention than a page with few visits. This helps determine whether the issue sits in the page, its audience, or its measurement.
- Bring the answer above the fold. Check what mobile visitors see before they scroll. Place the page’s core promise, relevant details, and a clear next action near the top. When someone searches for a specific service, the first screen should make that service easy to recognize. Test menus, buttons, and forms on mobile so the intended interaction is easy to find and use.
- Improve the experience before changing the keyword. Confirm that the page meets the intent behind its target keyword, then address unclear headings, missing details, or generic copy. Check loading speed and remove obstacles to reading and navigation. A relevant page can fully satisfy a visitor without prompting another page view, so judge engagement against the page’s goal.
- Measure the effect of each revision. Change one meaningful element at a time, such as the headline, opening copy, or call to action. Compare the same landing page, traffic source, and conversion signals before and after the change. If engagement improves after an ad’s promise is aligned with its destination, that is a clearer explanation than the sitewide bounce rate alone.
High-traffic pages disproportionately affecting bounce rate
- Rank landing pages by traffic before reviewing the sitewide figure. Start with the top 20 landing pages, then compare their bounce rates individually. A homepage may have a higher rate than inner pages because it offers visitors many routes forward. That pattern alone doesn’t identify the reason. Look for pages combining substantial traffic with weak interaction, then compare their purpose and audience. A high-traffic page can influence the overall result more than a page receiving few visits, so prioritize the pages with the greatest reach.
- Set a consistent traffic threshold for your review. Use a threshold such as 100 visits, 1,000 visits, or 50 sessions when filtering pages. These are alternative ways to narrow the analysis, not requirements to combine. Apply the same threshold and date range across the pages you compare. A page just below the chosen cutoff may still matter if it supports an important conversion, so retain business-critical pages in your review.
- Check that recorded interactions match real visitor behavior. Review how analytics tracks actions such as form submissions, menu selections, or downloads. If a meaningful action isn’t recorded, analytics may miss how visitors use the page. If an event fires without a genuine interaction, it can distort engagement data. Compare recorded events with the actions visitors are meant to take, and separate useful signals from measurement noise before deciding that bounce rates point to an experience problem.
- Investigate loading speed on pages with elevated exits. Pages taking three seconds or longer to load bounce 38% more often than pages loading in under one second. A delay can interrupt the visitor before the page’s message or call to action appears. Compare load speed with engagement on the same landing page, then inspect heavy images, scripts, and other elements that delay content. Test the page on mobile as well as desktop, since a fast desktop experience doesn’t establish that mobile visitors see the same performance.
- Connect the search result to the landing experience. For a high-traffic entry page, compare the search query and meta description with the page headline. If the description promises a specific answer but the page opens with unrelated material, visitors may leave before they find it. Review bounce rate alongside page views, time on page, interactions, and loading speed. Together, these measures offer more insight than a percentage alone and can help distinguish a content mismatch from a technical delay or tracking issue.
Interpreting bounce rate by website objective
Set the website’s objective before deciding whether a bounce rate signals a problem. A session that ends on one landing page might mean the visitor succeeded, failed to find what they needed, or completed a task.
- Define the outcome each page should achieve. A product page may encourage a purchase, while a support article may answer a specific question. Each purpose sets different expectations for what visitors do next. Write down the intended outcome for each important landing page, such as submitting a form, finding business hours, or understanding a service. Then assess engagement against that outcome, not against the performance of an unrelated page.
- Recognize when a one-page visit meets its purpose. Someone who reads an article, finds a phone number, or checks a business address may leave satisfied without opening another page. Bounce rate may be less useful for judging conversion success on a one-page website, or when visitors can get what they need from a single page. Check whether the page delivered its intended answer before treating a high rate as a problem.
- Measure actions that match the page’s goal. For a lead-generation page, track whether visitors submit the form or use its contact details. For an online store, focus on purchase activity rather than assuming everyone should browse several pages. Analytics is more useful when its events reflect meaningful actions. A page can have a high bounce rate and still meet its goal, while a low rate can coincide with few completed outcomes.
- Separate engagement from search visibility. Treat bounce rate as an analytics measure of visitor sessions, not as a substitute for business results or a standalone ranking factor in your decisions. Search traffic, for example, can bring visitors looking for a direct answer. If the landing page provides it, fewer additional page views don’t automatically mean the experience failed. Consider engagement alongside conversions, page purpose, and visit quality.
- Choose improvements that match the page’s job. If a service landing page needs enquiries, make its offer clear and its contact action easy to find. If an informational page already answers its subject, provide a relevant next step without forcing unnecessary navigation. Review the page objective, visitor behavior, and recorded outcomes together before changing its layout. For technical issues affecting page function, get website support to address the experience behind the metric.
New Wave Digital Designs
New Wave Digital Designs can help make bounce-rate data easier to interpret and show what visitors experience on your website. When analytics points to a page issue, website support can help investigate technical behavior, while website maintenance can address ongoing site upkeep. The next step depends on the evidence: a tracking concern, a page that doesn’t match visitor intent, or an experience that needs refinement. Reviewing traffic patterns, page purpose, and visitor actions together helps ensure changes support the website’s objectives rather than an arbitrary benchmark. For businesses in New Jersey, including Somerset County, Hunterdon County, and Morris County, this review can provide a practical starting point.
Contact New Wave Digital Designs for help understanding what may be driving your website’s bounce rate.
Turn your findings into a clearer next step
If you’re still asking why your website’s bounce rate is so high, focus your review on the page, the visitor’s goal, and the action that matters. This gives you a practical way to decide whether to refine the experience, maintain the site, or address how its systems support your objectives.
New Wave Digital Designs provides website maintenance, website support, and AI Agents. These services can help with ongoing site care and technical assistance, or support businesses exploring AI. The goal is to make your website work more effectively toward the outcomes you value, rather than chasing a metric in isolation.
Contact New Wave Digital Designs to discuss a thoughtful next step for your website. A clearer diagnosis can help you move forward with purpose.
Frequently Asked Questions
What is a good website bounce rate by industry and website type?
There’s no single good rate for every industry or website type. A September 2024 benchmark put the cross-industry median at 44.04%, while education was 46.28% and ecommerce and marketplaces was 38.61%. For ecommerce websites, a typical range is 20% to 45%. Use these figures to frame comparisons, then compare similar pages and goals. A local service page targeting Somerset County, New Jersey, may have different visitor expectations than an online store.
How can slow page speed increase bounce rate, and how can I test it?
Slow pages delay the information or action visitors came to find, making them more likely to leave before engaging. Pages taking three seconds or longer to load bounce 38% more often than pages loading in under one second. Test the same page on mobile and desktop, and note when the main content becomes usable. Compare results across pages, then investigate whether large images, scripts, or other elements are delaying the experience.
How do mobile usability and responsive design affect bounce rate?
Mobile usability affects how easily visitors can read, navigate, and act on a smaller screen. If a responsive page clips its headline, has a hard-to-tap menu, or makes a form awkward to complete, visitors may leave before finding what they need. Test key paths on an actual phone, including opening the navigation and submitting a form. For a New Jersey business page, make sure location details and contact options are easy to find on mobile.
How do landing page content, headlines, and calls to action affect bounce rate?
A headline sets an expectation, and the opening copy should quickly meet it. For example, a page titled “WordPress Website Support” should make that subject clear before introducing other services. The call to action should suit the visitor’s likely next step, such as requesting help or viewing service details. Compare how visitors respond to different headline and button wording while keeping the page’s central promise consistent.
When is a high bounce rate normal or not a problem?
A high rate may be normal when a visitor completes a one-page task, such as reading an answer, finding an address, or calling a business. It can also be less useful for judging conversion success on a one-page website. A blog post that fully answers its subject can meet its goal without another click. Assess results against the page’s objective and completed actions instead of assuming every exit signals a poor experience.