
Traffic alone can make a new website look successful while hiding whether it’s helping the business. Measuring the success of a new website launch means comparing performance with clear goals and interpreting feedback, conversions, active users, traffic, and page views together. The right measures depend on what the website is meant to achieve.
A rise in visitors can be encouraging, but it’s only part of the picture. You also need to understand what people do after they arrive, where they leave, and whether the experience meets their needs.
This guide explains how to set practical launch goals and choose metrics that make progress visible. You’ll learn how to interpret customer feedback, track conversions and active users, and put traffic and page views in context, so you can see what’s working and what to refine next.
Key Takeaways
- Gather feedback from customers and prospects to understand not only whether they try the new site, but whether they continue using it.
- Set measurable launch goals that connect to business outcomes, then choose metrics that show progress toward them.
- Track each step in the conversion path to spot where visitors lose momentum and where the experience may need refinement.
- Define what meaningful activity looks like for your website before interpreting daily or monthly active-user measures.
- Read traffic and page views alongside conversions and feedback to distinguish visits from genuine progress.
1. Customer and prospect feedback
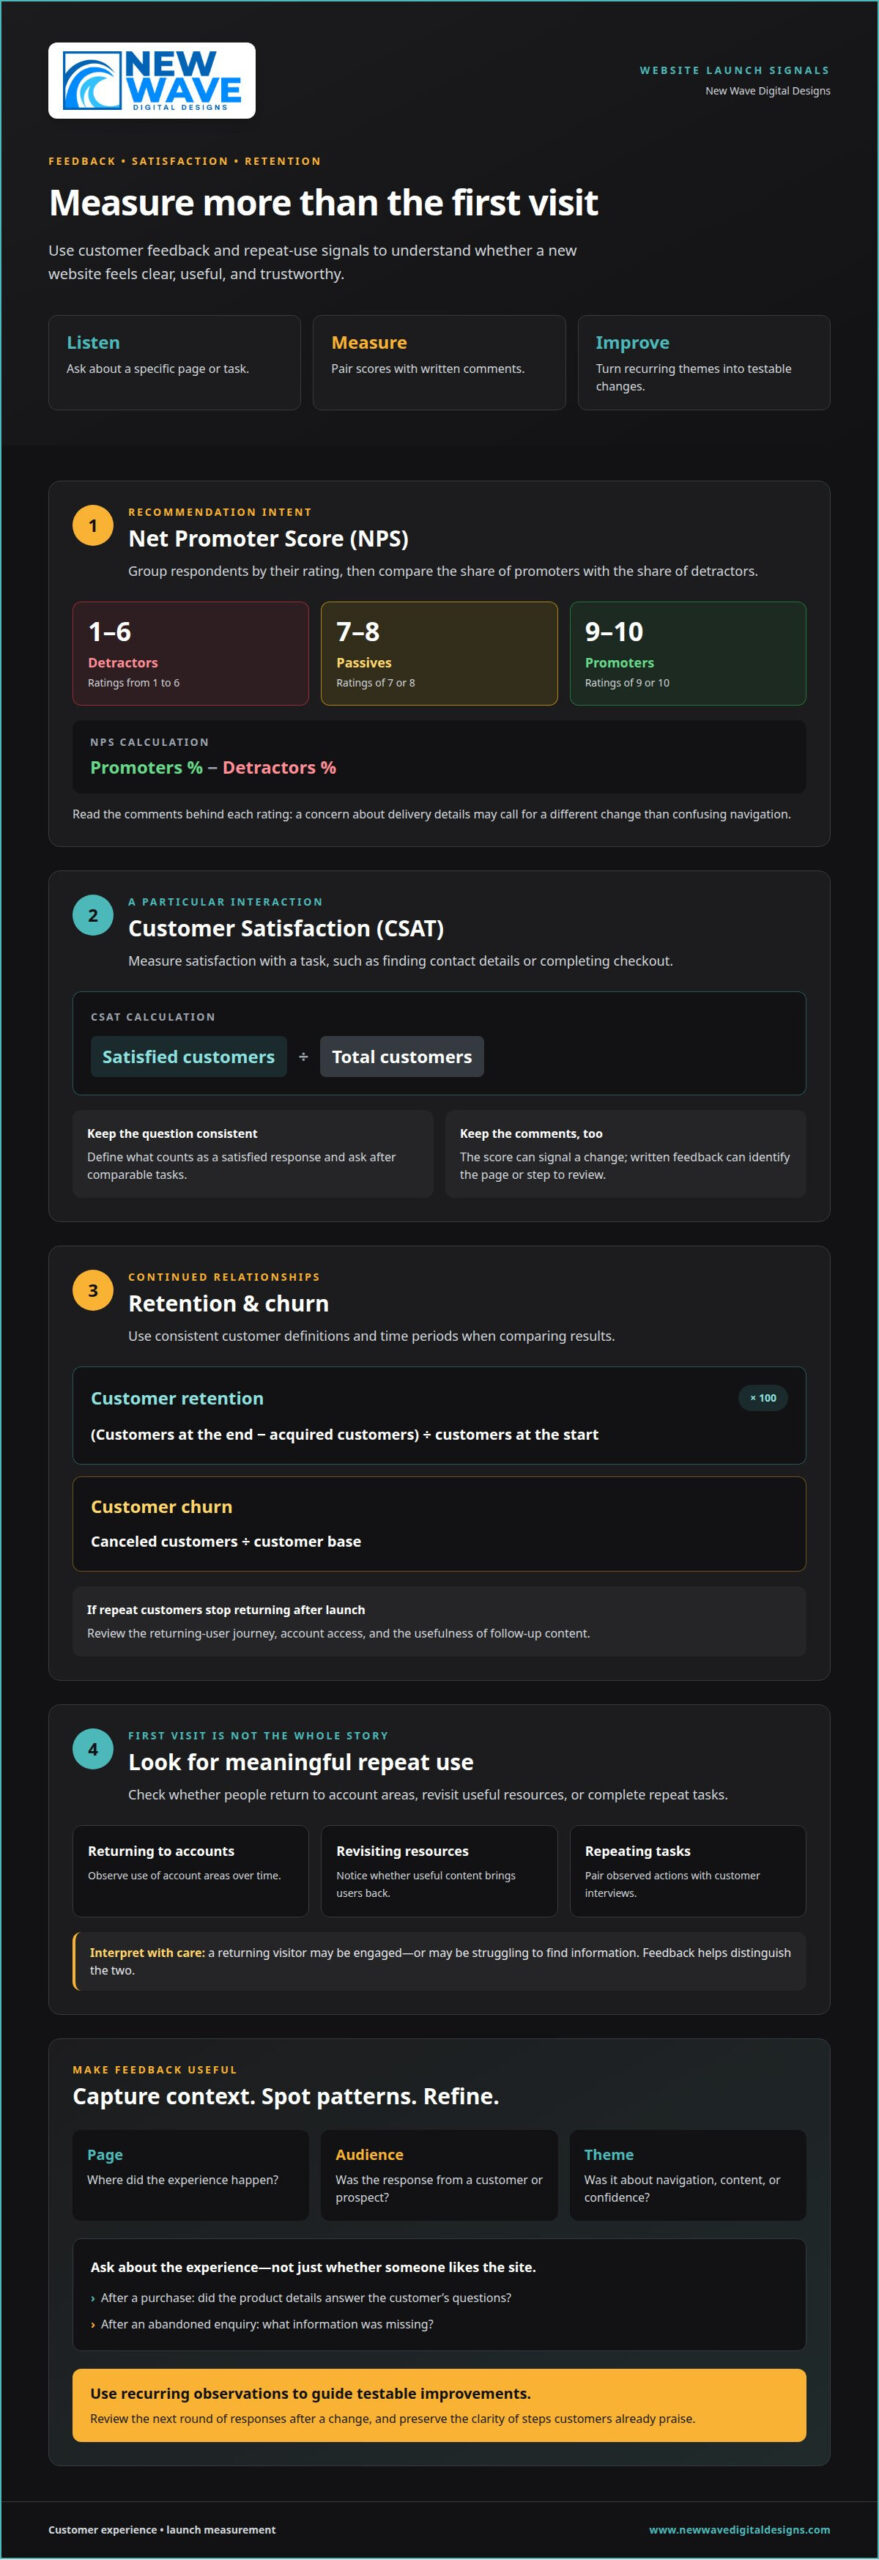
Customer and prospect feedback reveals whether a new website feels clear, useful, and trustworthy. Analytics may show that visitors leave a page, but a short follow-up can help explain why. Ask customers to describe a task they completed, then invite prospects to say what stopped them. Look for recurring comments about navigation, content, or confidence. One response may reflect personal preference; repeated feedback about the same checkout step points to a stronger pattern.
Make feedback specific to the experience. After a purchase, ask whether the product details answered the customer’s questions. After an abandoned enquiry, ask what information was missing. Focus questions on a page or task instead of asking whether someone simply likes the website. Record the page, audience type, and feedback theme. This makes comments more useful alongside conversion data and helps distinguish a content issue from a technical obstacle.
Net Promoter Score (NPS) adds a structured view of recommendation intent. Respondents rating the experience from 1 to 6 are detractors; ratings of 7 or 8 are passives; ratings of 9 or 10 are promoters. Calculate NPS by subtracting the percentage of detractors from the percentage of promoters. Read the comments behind each rating, too. A low score tied to confusing delivery details suggests a different improvement than a low score tied to difficult navigation.
Customer Satisfaction (CSAT) measures satisfaction with a particular interaction. Calculate it by dividing satisfied customers by total customers. Define what counts as a satisfied response and ask the same question after comparable tasks, such as finding contact details or completing checkout. Track the result alongside written comments. The score can signal a change, while comments often explain which page or step deserves attention.
Retention and churn show whether the website supports continued customer relationships. Calculate customer retention as customers at the end minus acquired customers, divided by customers at the start, multiplied by 100. Calculate churn as canceled customers divided by the customer base. Apply consistent time periods and customer definitions when comparing results. If repeat customers stop returning after launch, review the returning-user journey, account access, and the usefulness of follow-up content.
Customer usage matters beyond the first visit. Product adoption tracking should show whether customers continue using a product over time, not just whether they try it once. For a website, examine whether users return to account areas, revisit useful resources, or complete repeat tasks. Pair observed actions with customer interviews: a returning visitor may be engaged, while another may be struggling to find information. This distinction keeps launch activity connected to real customer value.
Close the feedback loop by turning recurring observations into testable improvements. If prospects say service details are hard to compare, refine the page and review the next round of responses. If customers praise a streamlined booking path, preserve its clarity while assessing other steps. This cycle connects feedback, satisfaction, retention, and usage to specific design decisions, bringing a human perspective to numerical measures.
2. Defining goals and tracking launch metrics
Start with a business outcome, then choose a measurable website goal. A retailer might track online sales; a service business might track qualified leads or booked consultations. Set relevant targets for revenue, price point, sales, prospects, leads, and conversions. Give each target a clear definition, an owner, and a review period. This makes measuring the success of a new website launch more meaningful than watching activity without a decision in mind.
Which analytics tools are best for measuring a new website launch? Google Analytics 4 can help track website traffic and on-site actions, while Google Search Console can show search visibility and organic clicks. Choose tools that capture your defined goals, and confirm that key actions, such as form submissions, are recorded consistently.
What are realistic website launch benchmarks for traffic, engagement, and conversions? There is no single useful benchmark for every site: results depend on the audience, offer, channel, and starting point. Set a baseline using comparable pre-launch performance, then compare similar periods and traffic sources against your goals. A conversion target should reflect the value of the action and the visitors’ intent.
For a launch campaign, connect each channel to a purpose. Track campaign visits, qualified prospects, leads, and completed conversions, then compare the outcomes with the campaign’s objectives. Align product and marketing teams around the same launch goals and key performance indicators. Otherwise, one team may celebrate reach while another measures sales, making the overall result difficult to interpret. For small and mid-sized B2B organizations seeking senior guidance to unify these metrics, Budget Boosters offers fractional CMO services that bridge the gap between marketing initiatives and revenue outcomes.
Use results to refine the launch rather than merely report them. Businesses that track key metrics are twice as likely to achieve their business targets. Mantic Point’s new website generated 12 product demo enquiries in its first month. It also produced a 400% increase in organic contacts in March compared with March 2015. These examples show why goals should connect website activity with business outcomes.
What are common website launch measurement mistakes and risks? Common errors include tracking page views without a business goal, counting duplicate submissions, and comparing different date ranges or channels. A missing event can make a working form appear ineffective. Before launch, test each important action, document its definition, and check that reports distinguish genuine leads from repeated or incomplete entries.
Review performance consistently and make one focused adjustment at a time. If a campaign brings visits but few qualified leads, inspect the landing-page message and next step. If leads rise but sales do not, examine lead quality and follow-up. For teams seeking an evidence-led approach to campaign optimisation, resources like freshfacedmarketing.co.uk can assist in turning web analytics into practical marketing strategies. Record each change alongside its metric so later reviews can connect the outcome to the decision.
3. Conversion rates and funnel drop-offs
A conversion is a completed action that supports a website’s purpose, such as an enquiry or purchase. Calculate the conversion rate by dividing completed actions by eligible visits, then express the result as a percentage. Define the action and audience first. A product purchase and a newsletter signup serve different purposes, so combining them can obscure which outcome the launch supports.
Map the visitor journey as a sequence of observable steps. An online store funnel might run from product page to cart, checkout, and completed order. A service website might move from landing page to service details, contact form, and submitted enquiry. Track each stage separately. Where progress slows, visitors may need clearer information or a more direct next step.
Check that every meaningful action is recorded once. For an enquiry form, distinguish opening it from submitting it. For checkout, distinguish adding an item from completing the purchase. Test these events before interpreting launch results. Duplicate tracking can inflate activity, while a missing completion event can hide conversions that actually occur.
Review funnel movement by relevant audience and traffic source. Visitors arriving through a product search may behave differently from those following a campaign link. Compare similar groups and periods, then examine the page visitors leave from. If they view a service page but don’t reach the contact form, the next step may be unclear or key details may be missing.
Mantic Point’s new website generated a 100% increase in all contacts month-on-month, with February 2016 mentioned in its reporting. This result illustrates why contact volume matters alongside visits. To understand the change, connect each contact to its source and journey through the site. More submissions provide context, but the funnel reveals which paths contributed to them.
Investigate a drop-off before changing the page. Check whether the button works, the form loads, and required information is easy to find. Then review the wording, page sequence, and mobile layout. For example, if visitors reach checkout but don’t finish, inspect the checkout experience rather than rewriting unrelated homepage content.
Make one focused improvement at a time, then compare the same funnel stages. If a clearer call to action moves more visitors from a service page to a form, keep the change and continue examining later steps. Changing several elements at once makes it harder to identify what influenced the result.
Use conversion rates to assess outcomes and drop-off points to locate friction. A launch report becomes actionable when it connects a defined goal, a recorded event, and a specific page. This turns a broad performance signal into a practical decision about what to refine next.
4. Daily and monthly active users
Daily Active Users (DAU) and Monthly Active Users (MAU) measure people who perform a defined, meaningful action. For a website, that action might be signing in, using a key feature, or returning to complete a task. A page view alone may not indicate meaningful engagement. Define “active” before launch and apply the same rule consistently in every report.
How soon after launch should you evaluate website success? Check tracking as soon as the site launches so you can correct broken events or missing actions early. Assess active-user patterns over a period that reflects how often visitors are expected to return, then compare the results with the launch goal.
DAU captures daily activity; MAU shows users active during a month. The measures answer different questions. A tool people need every day may benefit from daily tracking, while a resource used occasionally may be better understood through monthly activity. Choose the measure that fits the website’s purpose rather than assuming frequent visits always indicate greater value.
Set an active-user goal around a real business outcome. For example, a launch goal can be to acquire 500 active users within one month. Define what counts as active before measuring progress. If a site supports appointment booking, completing or managing a booking could be more informative than visiting the homepage. A clear action gives the target practical meaning.
Choose the minimum action carefully. For a messaging app, sending one message might define an active user. A business website needs its own relevant action, such as saving a product or accessing a customer account. Avoid counting passive events that don’t indicate use. Keep the definition stable after launch, or comparisons between reporting periods lose their meaning.
Separate new users from returning users to understand whether people come back after their first visit. Group users by when they first became active, then compare their later activity. For example, users who registered during a launch campaign may behave differently from existing customers. This view can reveal whether the site provides value beyond initial curiosity.
Interpret DAU and MAU alongside the action that defines activity. If monthly active users rise but key tasks remain untouched, the headline metric may overstate engagement. A smaller group that repeatedly completes useful tasks may offer a stronger signal. Pair user counts with task completion and feedback to understand both the scale and quality of use.
Document the definition, reporting period, and audience for each active-user measure. A launch dashboard might label a measure “monthly users completing account tasks” rather than simply “active users.” Clear labels make reports easier to interpret and help teams compare like with like as the website evolves.
5. Website traffic and page views
Traffic shows how many visits reach a website, while page views show which pages attract attention. Neither measure proves visitors found what they needed. Read both alongside the launch goal: a service site may value visits to enquiry pages, while a store may focus on product pages. Treat traffic as a signal, not a verdict.
Mantic Point’s new website received 504 organic visits in March 2016, compared with 167 in March 2015. Its previous website received 247 organic visits in January 2016, the last full month before launch. The new site produced an increase of over 100% in organic visits compared with that January baseline. These figures show why the comparison period matters: March-to-March and launch-to-last-full-month answer different questions.
How do you compare website performance across devices, traffic sources, and time periods? Use consistent metric definitions and comparable date ranges, then segment results by device and source. Compare organic visits with paid or referral visits separately. Check whether mobile and desktop visitors view important pages or complete key actions.
Page views add detail to traffic patterns. If a product page draws visits but few people continue to related information, inspect its links and content hierarchy. If a landing page attracts organic traffic, check whether visitors take the intended next step. Compare page views with entrances, exits, and conversions to understand the journey, not just its volume.
Use a baseline before judging launch performance. Compare the same month across years when seasonal patterns may matter, or compare with the last full month of the previous site. Mantic Point’s January 2016 baseline and March comparisons illustrate these distinct approaches. Keep the date ranges and traffic sources consistent, and note any campaign activity that could influence the pattern.
How do you measure website speed, accessibility, and technical performance? Test important pages on mobile and desktop, note loading delays, and check that links, forms, and navigation work. Review keyboard access, image descriptions, form labels, and text contrast. These checks can reveal barriers that traffic totals cannot show.
When traffic rises without deeper page engagement, inspect the pages visitors enter and leave. When page views increase alongside useful actions, the added attention may be supporting the site’s purpose. A practical review connects source, device, page, and next action, then identifies the specific experience to improve. Improve your website’s traffic experience by shaping clearer pathways from discovery to useful content.
New Wave Digital Designs: Shopify Website Design
New Wave Digital Designs offers Shopify Website Design for businesses creating an online store or refining an existing one. If launch metrics show that visitors aren’t moving from product pages toward purchases, look beyond the numbers at the experience behind them. A considered design can align product information, navigation, and shopping pathways more clearly with your goals.
For websites built on other platforms, New Wave Digital Designs also offers WordPress Website Design, SquareSpace Website Design, and Website Maintenance. These services can help when the next step is improving the website itself or maintaining its performance, rather than changing marketing goals alone.
Bring your launch goals and performance questions to New Wave Digital Designs. Contact the team to discuss Shopify Website Design.
Shape the next stage of your website
Measuring the success of a new website launch is most useful when it informs what you build next. Treat each finding as a design decision: clarify a confusing pathway, strengthen an important page, or refine how the site reflects your business. Keep observing how visitors respond as your priorities evolve.
New Wave Digital Designs can turn those priorities into a website experience through Shopify Website Design, WordPress Website Design, or SquareSpace Website Design. Choose a platform and design direction that support how your business serves its audience, not just how the site looks.
If you’re ready to discuss the next step for your website, contact New Wave Digital Designs. A thoughtful next iteration can give your digital presence room to grow.
Frequently Asked Questions
What KPIs should you track after launching a new website?
Track a focused set of KPIs that connects site performance to business priorities. Pair an outcome measure, such as qualified enquiries or completed purchases, with diagnostic measures that help explain it, such as landing-page visits or form starts. For example, a rise in enquiries is more meaningful when you can identify which pages and channels attracted suitable prospects. Tie each KPI to a clear decision, not just a dashboard display.
How do you set baseline goals and measure website performance before and after launch?
Record pre-launch results using consistent definitions, date ranges, and traffic segments, then compare equivalent periods after launch. Note context that could affect results, such as a seasonal promotion, campaign, or major content update. For example, if you redesign a product page, record the change date and compare engagement and the sales journey with the earlier version. This creates a more useful reference than comparing totals without context.
How do you measure SEO performance and organic traffic after a website launch?
Assess organic search through impressions, clicks, search queries, and the landing pages receiving visits. Check whether important pages appear for relevant searches, then see whether visitors continue toward useful actions. For example, if a refreshed service page gains search visibility but attracts irrelevant queries, refine its content to better match the intended audience. Also monitor pages that were moved or renamed so search engines can find and understand their updated destinations.
How do you track website conversion rates, leads, and sales?
Set up a distinct tracked event for each valuable action, such as a valid form submission, completed order, or phone enquiry. Check that test submissions and duplicate events don’t inflate totals. Connect digital events with lead or sales records to distinguish an enquiry from a qualified opportunity or completed sale. For example, compare form submissions with sales records to see whether enquiries progress beyond initial contact.